Main widget ✨
Overview
The IntelliProve Main Widget is a central component that gives users a clear, comprehensive overview of their well-being and guides them toward meaningful action.
It is designed to:
- Summarize the latest Face Scan and compare with previous results and levels.
- Help users understand their current well-being state by the aid of the well-being circle.
- Show progress over time and understand trends.
- Encourage consistent engagement through reminders and personalized recommendations.
It consists of 3 tabs:
- Results
- Trends
- Profile
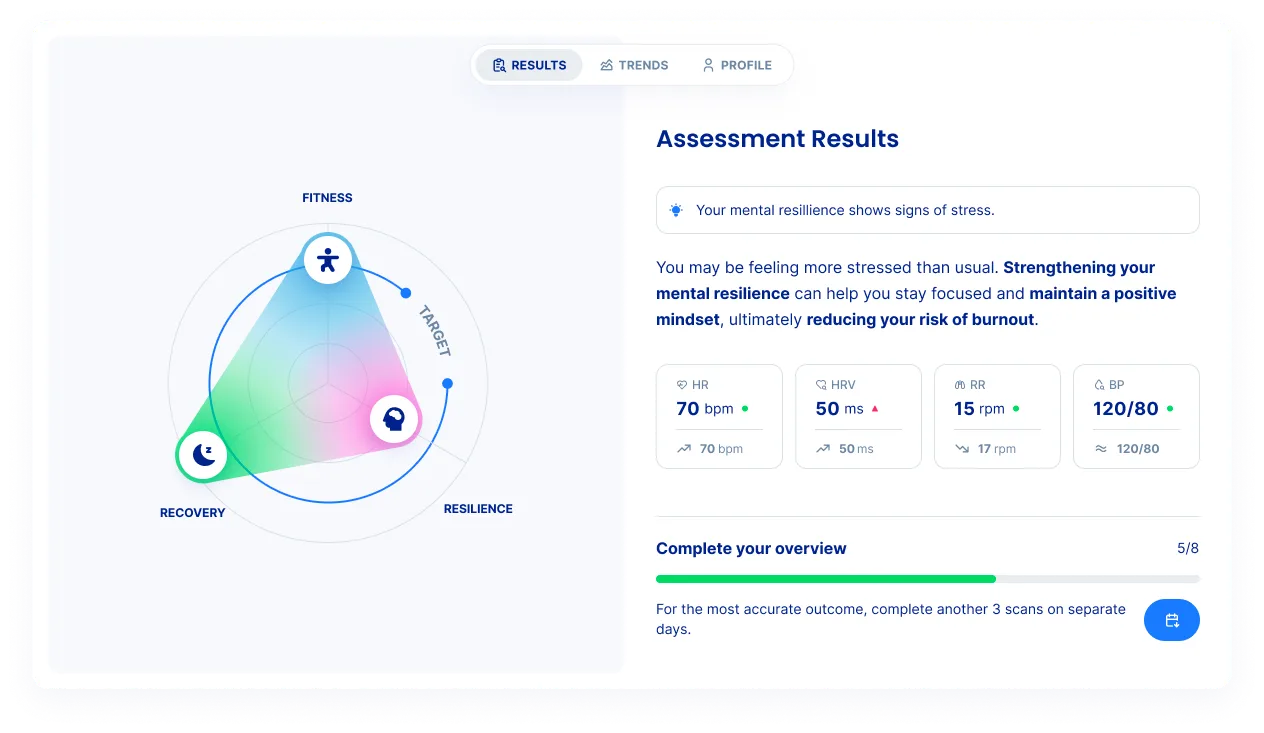
Tabs
- Results
The Results tab is the main entry point. It answers two simple questions: “How am I doing right now?” and "What should I do?". It combines visual interpretation, explanations, and actions in one place.
The well-being circle
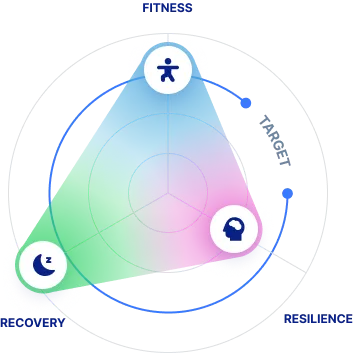
The Well-Being Circle is a visual representation of overall well-being, divided into three domains:
- Fitness: Fitness reflects how physically healthy the user is compared to an average healthy person of the same age and sex. It is based on:
- Resting heart rate
- Resting Respiratory rate
- Blood pressure
- Heart rate variability (SDNN)
- Registered activity and flexibility (Self reported data)
- Resilience: Resilience reflects how well the user copes with mental and emotional challenges. It takes into account:
- Sleep quality
- Stress levels
- Subjective mental load (from self reported data)
- HRV-based autonomic nervous system balance (ANS)
- Recovery: Recovery reflects overall vitality and the body’s ability to restore itself. It is based on:
- Daily physical activity
- Body balance
- Sleep habits
- Stress load patterns
The target line is a reference line that takes into account user details like age and sex. It shows where a normal, healthy person of the same age and sex typically falls. It serves as a motivational benchmark to help users keep their well-being on track. Larger areas indicate stronger performance while reduced areas below the target line indicate domains that may need attention.
Overview Section (Insights & Actions)
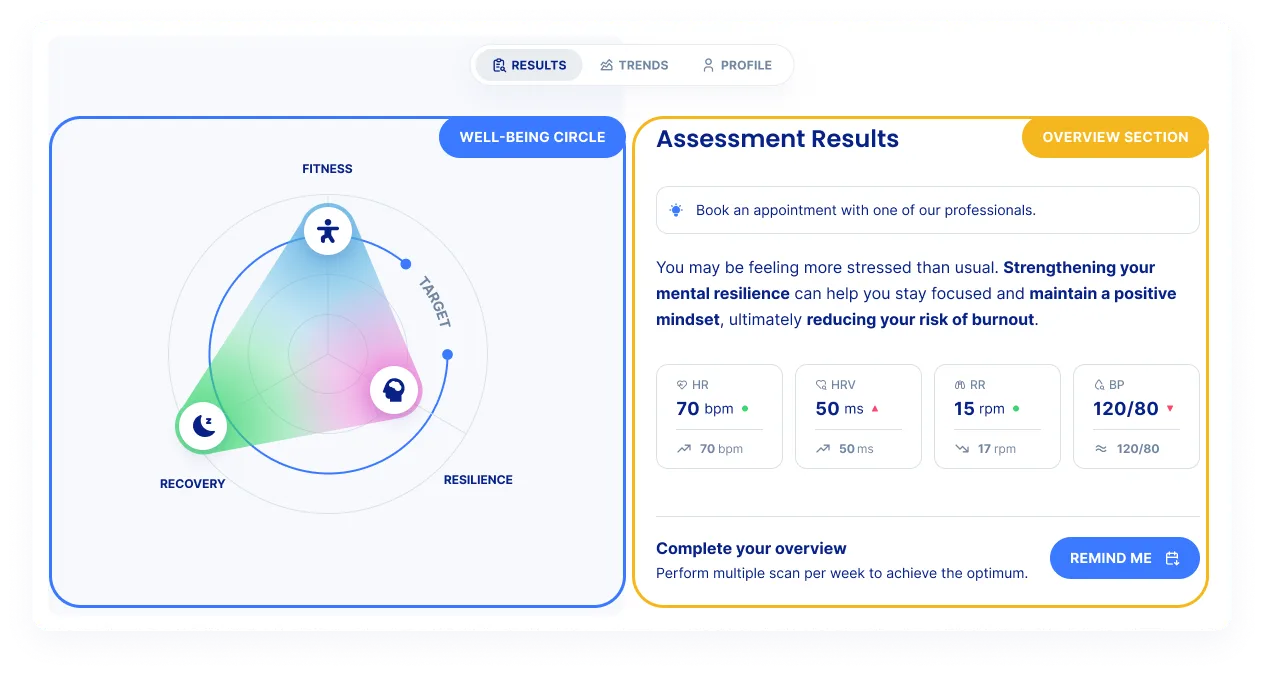
The Overview section summarizes the main conclusions from the face scan and historical data. It contains of four key elements:
- Recommendation
- A clear suggested action, such as booking an appointment or doing a small exercise.
- Feedback or tip
- A short, understandable explanation of what the results of the main widget mean.
- Biomarkers
- Displays last measurment biomarker values.
- Shows trends compared to previous measurements.
- Uses color indicators to show status.
- Reminder
- Allows users to schedule future assessments
- Adds reminders directly to their personal calendar by downloading the .ics file. It serves to help the user to check in and keep an eye on his well-being and act pro-active/preventive.
- Trends
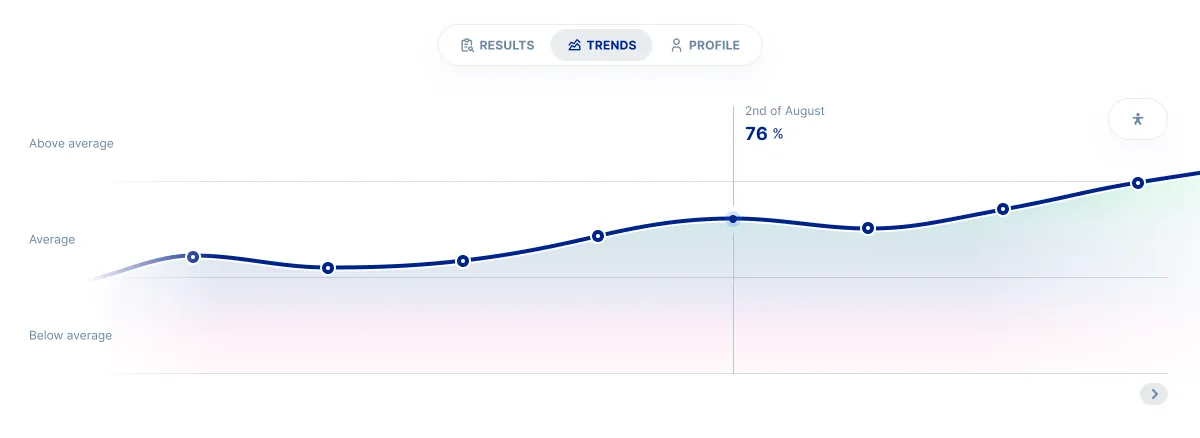
The Trends tab show Historical data for the 6 insights. It includes colored zones to indicate the status. The trends help the user see their evolution over time. It is useful to motivate users, reinforces positive and preventive behavior, and helps detect long-term patterns rather than focusing on one-off results.
- Profile
The Profile section lets users review their personal details, see their total scans, and check the date of their last assessment. The user data is used to determine their target.
How to integrate