Metrics
Overview
Metrics are a type of Health Insight that represent interpreted outcomes, offering users a personalized understanding of their current health or well-being. They are derived from Face Scan data combined with contextual data. They help users grasp actionable insights, such as mental stress levels, sleep quality, or energy balance.
IntelliProve currently provides six health metrics, including stress, sleep, mental health risk, energy balance, hypertension risk and general fitness. Each health metric has its own widget.
A detailed overview of each metric can be found in the Health Insights documentation.
Structure of a Metric widget
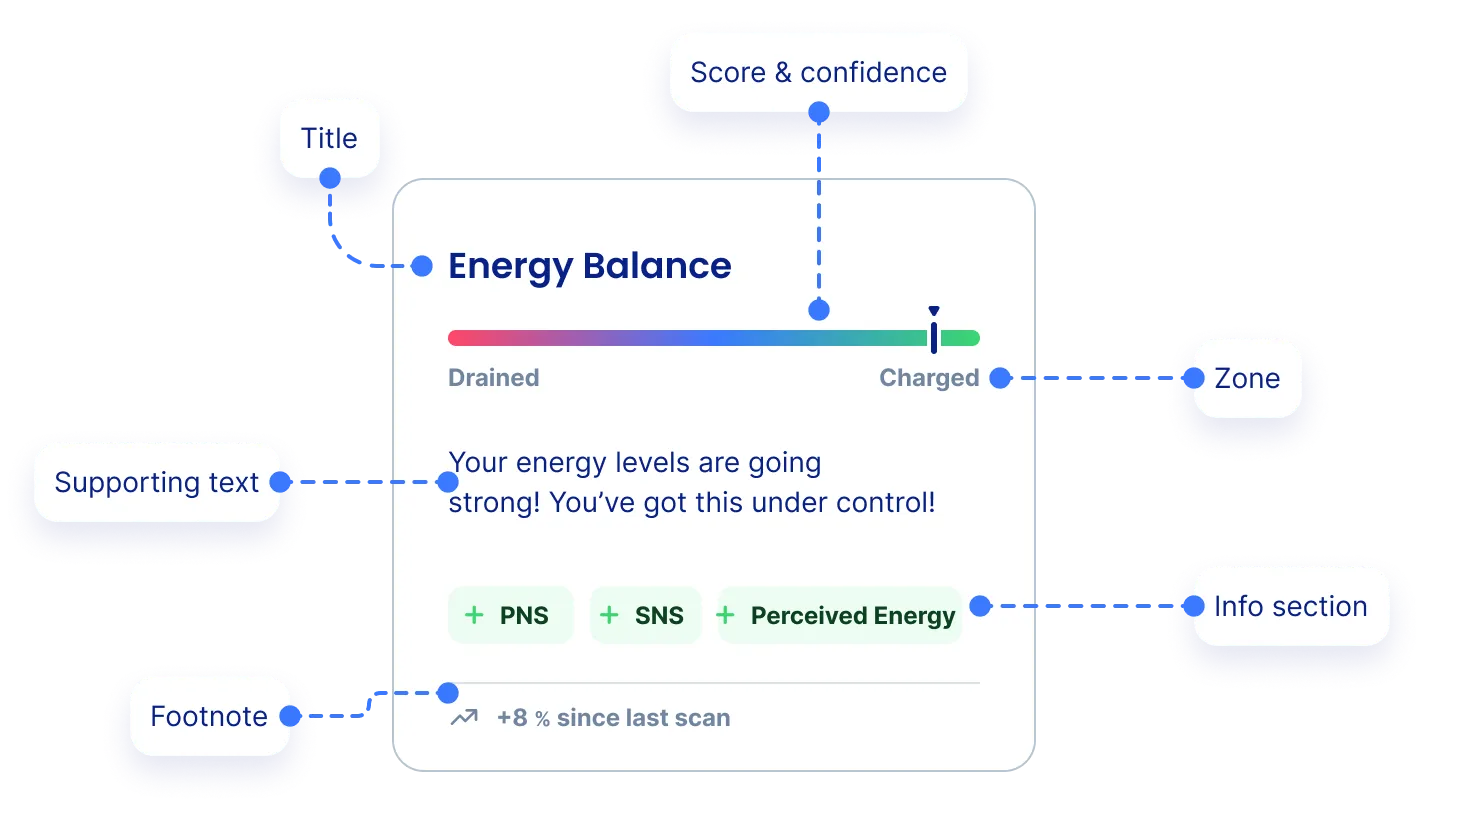
A Metric widget is composed of the following elements:
Element | Description |
|---|---|
Title | The name of the metric |
Supporting Text | Summarizes what the score means and may include actionable suggestions. |
Score & confidence | Displays your score (▼). Lower confidence results in a range, while higher confidence provides a precise value. |
Zone | Indicates whether the score is in a Suboptimal, Normal, or Optimal range. |
Info Section | Provides insight into how the result was calculated and which biomarkers and user inputs were used. Doubles as motivation |
Footnote | Showcases either previous value or indication to perform a new scan. |
Score and Confidence

Score (0–100)
- Indicates how the user is doing, relative to a healthy person of similar profile (age, sex, etc.).
- This value is central to determining the Zone (Suboptimal, Normal, Optimal).
Confidence
- A second value (0–100) representing the certainty of the result.
- Visualized using a bar around the score:
- Wide bar = low confidence (not enough scans).
- Narrow bar = high confidence (sufficient data).
- Confidence improves as the user performs more Face Scans over time.
Status Categories
Status reflects the reliability and timeliness of the displayed metric:
- No data – No measurements available yet.
- Preliminary result – Initial estimate, based on first scan; further scans recommended.
- Confirming – Getting there, approaching sufficient accuracy.
- Validated – Confident, stable result.
- Reconfirming – Latest result not up to date, no new scans for 7+ days.
This encourages regular usage and builds user trust over time.
Zones
Each metric score falls into one of three zones:
Zone | Score range | Meaning |
|---|---|---|
Suboptimal | 0–33 | Below average for the user’s profile |
Normal | 34–66 | Average range for a healthy person of similar profile |
Optimal | 67–100 | Better than average (excellent health condition) |
Zones are color-coded (e.g., red = suboptimal, green = normal, blue = optimal) and influence both the visual feedback and copy shown in the widget.
Linked Biomarkers & Surveys
Each metric is backed by a combination of:
- Biomarkers (e.g., heart rate, HRV, respiration rate)
- User inputs (e.g., perceived stress, lifestyle data)
- Historical patterns (e.g., trends over time)
This comprehensive approach ensures that scores are contextual, interpretable, and personalised.