Graph Widget V1 - deprecated
Intro
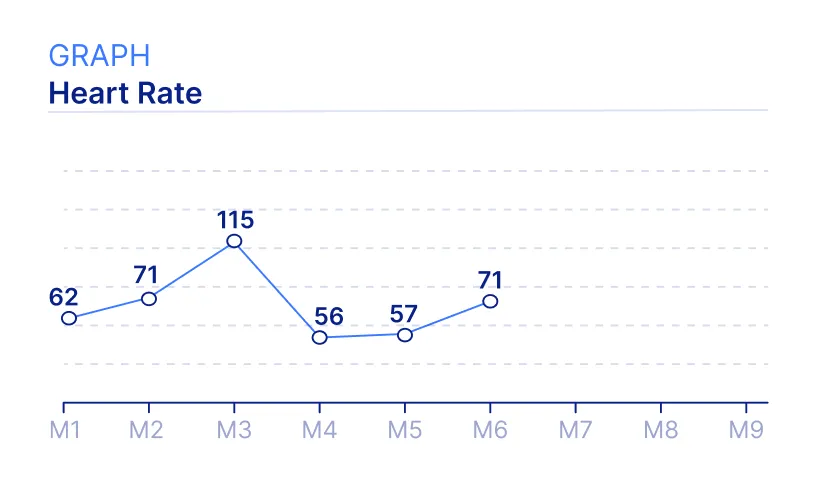
The Graph Widget offers a dynamic way to visualise the progression of a specific biomarker or metric over time. It enables users to track changes in their health status and gain insights into long-term patterns. Easily integrate it into your platform to help users understand how their health evolves.
Layout
Medium
Usage
Creating the widget
The code snippet below creates a Graph widget and mounts it to the DOM:
const intelli = IntelliProveWidgets("user_action_token");

const config = { /* config */ };
const variation = "default";
const themeOverrides = { /* theme overrides */ };
intelli.mountWidget(
    "#hr-graph-tile",
    "graph",
    config,
    variation,
    themeOverrides,
    1 /* version */
);
Config
The Graph widget requires additional configuration parameters that describe which parameter should be displayed. Specify the timerange and page to select a specific portion of the data.
const config = {
   parameter: "heart_rate",
   title: "Heart rate graph",
   start: "2024-12-21",
   stop: "2024-12-31"
}
Property | Description |
|---|---|
parameter string | Biomarker or metric of choice |
title nullable string | Optionally override the graph title with a string value of choice |
start nullable date string | Start date for the range of historical data to be retrieved Format: YYYY-MM-DD Default: TODAY - 8 days |
stop nullable date string | Start date for the range of historical data to be retrieved Format: YYYY-MM-DD Default: TODAY |
List of available biomarkers and metrics:
Parameter | Layouts |
|---|---|
heart_rate | medium |
respiratory_rate | medium |
resonant_breathing_score | medium |
heart_rate_variability | medium |
resting_heart_rate | medium |
resting_respiratory_rate | medium |
mental_stress | medium |
mental_health_risk | medium |
sleep_quality | medium |
energy_balance | medium |
Variation
Only one variation of the Graph Widget is available.
- "default"
Theme Overrides
The Graph Widget allows individual fine-tuning of the appearance.
The used accent colors are:
- Brand Primary
- Support 500